Research software · 3 November 2026 · Inam Ullah Khan
Beyond a grade: bringing retinal AI evidence into view.
An AI model can return a number in seconds. Understanding what sits behind that number is a different challenge. RetinalInsight puts the image, its contextual features and the model’s explanation in the same workspace.
A result that invites a closer look
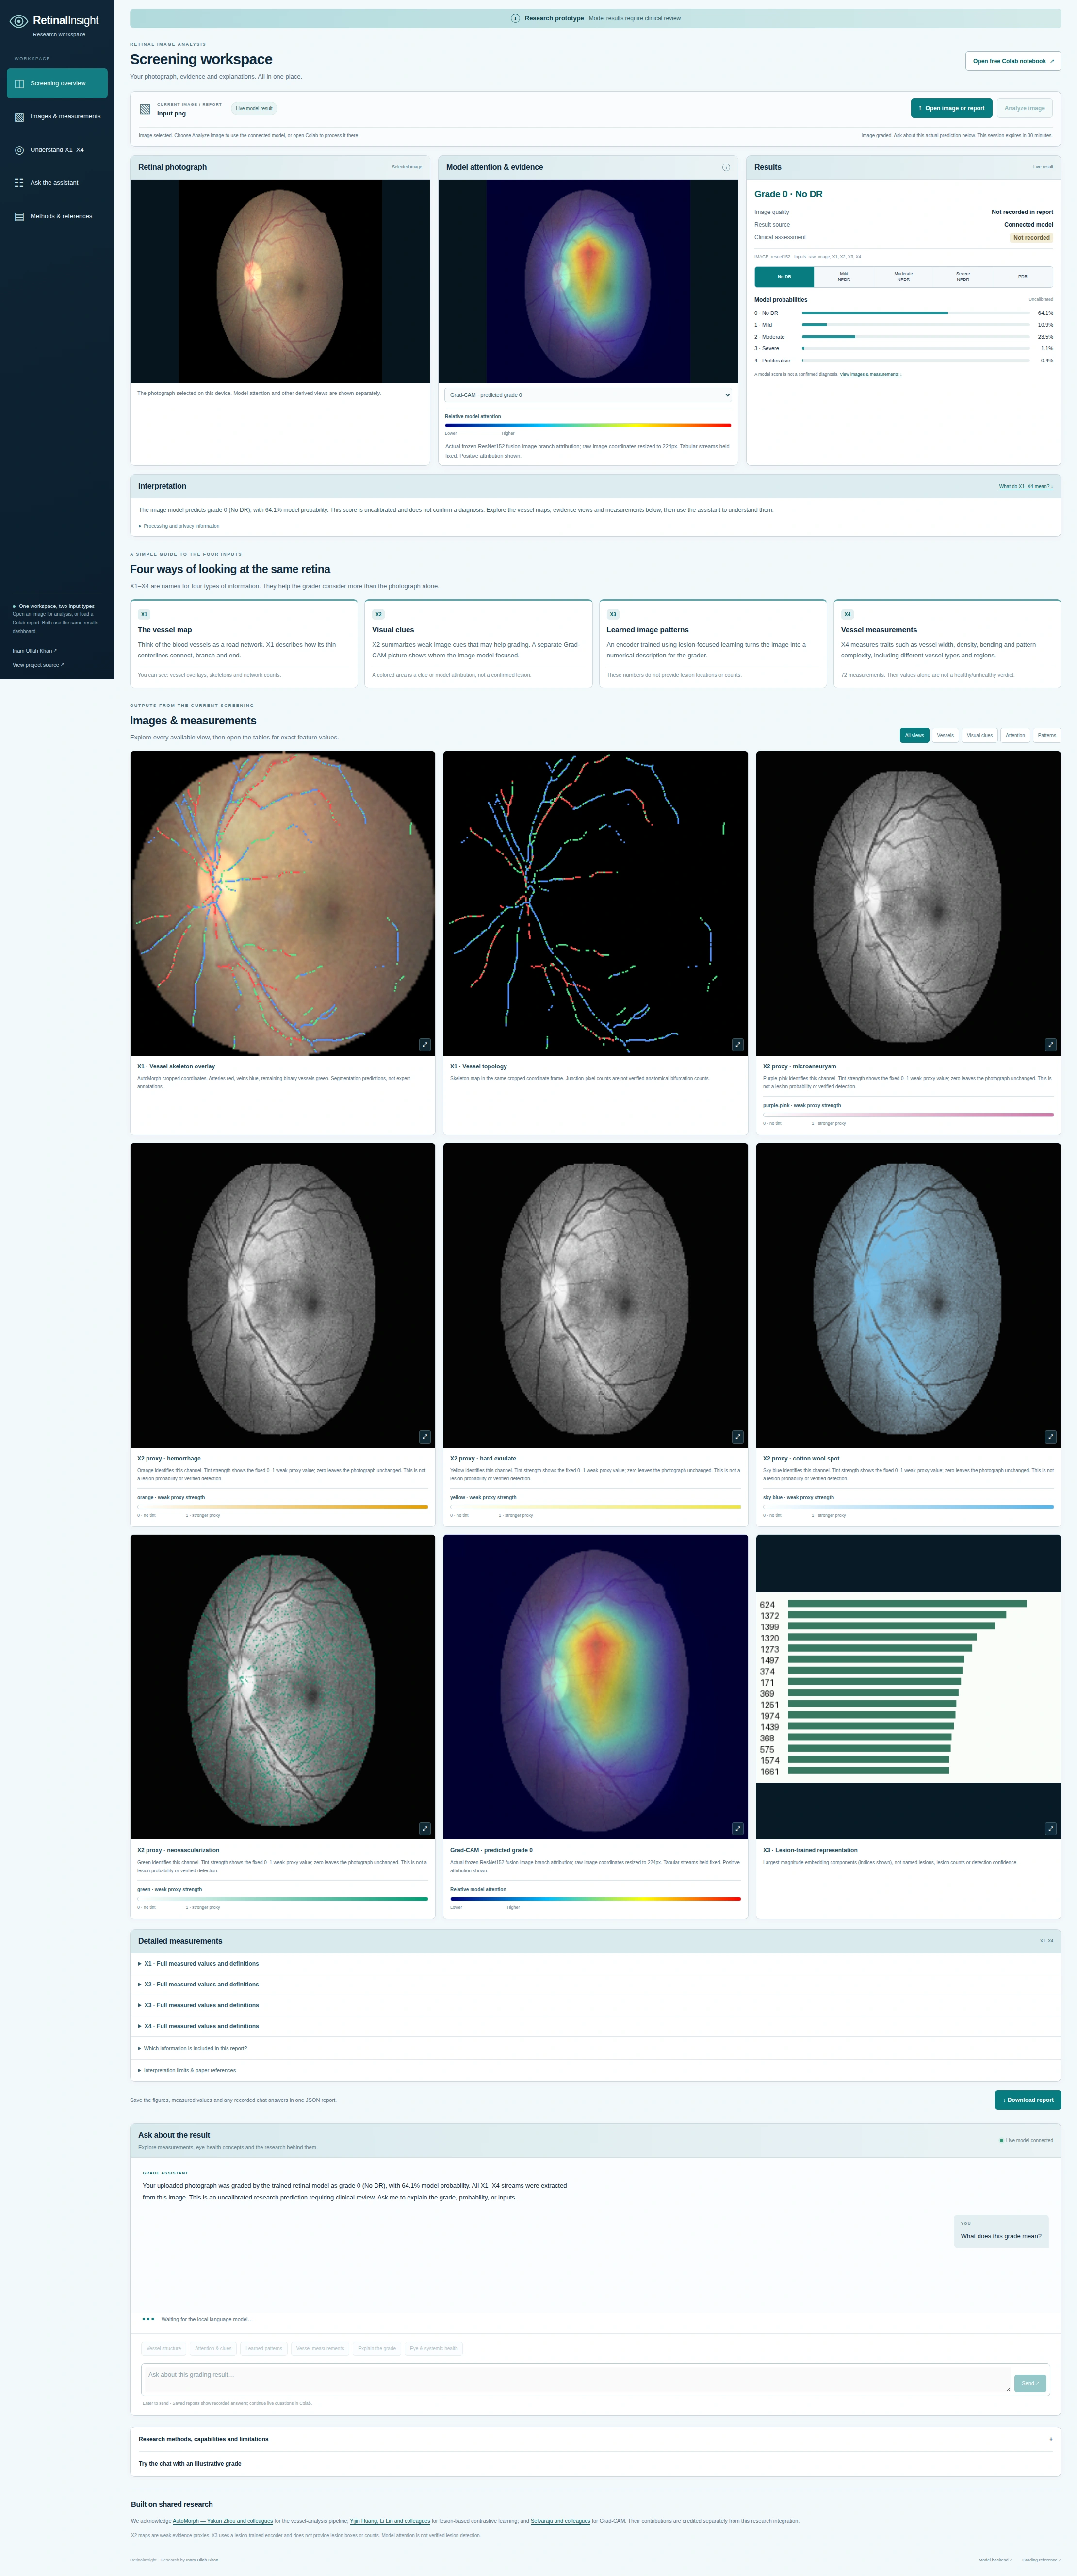
A retinal photograph is a view of a living network: vessels bend, divide and change in width, while image patterns provide further information for a grading model. A predicted diabetic retinopathy grade compresses that complexity into one output. My aim with RetinalInsight is to bring some of that context back into view.
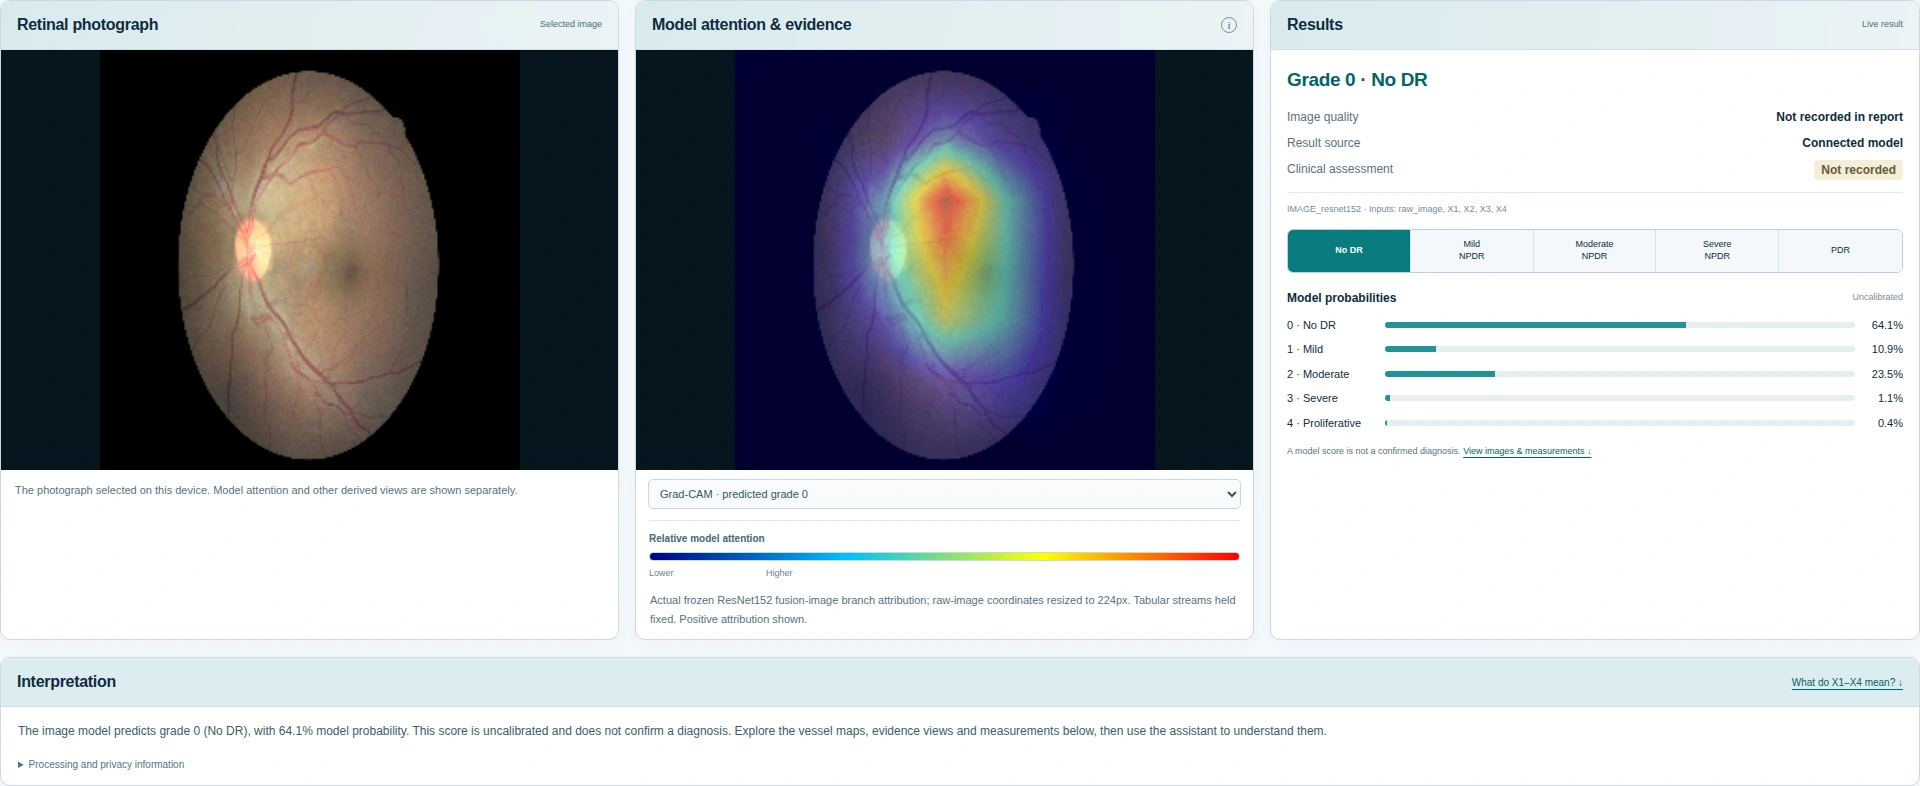
The workspace puts the original photograph next to the model’s probabilities and attention map. Below it, visitors can inspect the vessel structures, visual-evidence maps and measured biomarkers used to contextualise the result. The question becomes more useful: what was measured, where did the image model focus, and what can those observations reasonably tell us?
Four complementary views of the retina
X1 — the vessel map. Thin vessel centrelines describe the network’s structure: how it connects, branches and ends. Overlay and skeleton views make those extracted structures visible.
X2 — visual clues. Five colour-coded maps show weak image cues associated with lesion-related patterns. These heuristic proxies help describe the model inputs; they do not confirm that a particular lesion is present. Grad-CAM is displayed separately and highlights image regions contributing to the model’s predicted class.
X3 — learned image patterns. A lesion-trained encoder turns the photograph into a numerical representation for the grader. This stream captures learned features rather than supplying verified lesion locations, boxes or counts.
X4 — vessel measurements. The report exposes 72 vascular biomarkers, including descriptors of vessel width, occupancy, tortuosity, curvature and network complexity. Their units, assumptions and regional context matter: a measured value alone is not a normal-or-abnormal verdict.
From evidence to a conversation
The assistant is designed to help visitors ask about a grade, an image feature or a vascular measurement. It combines the current report with a curated, cited knowledge library. That makes the explanation inspectable: the values should come from the report, and the scientific context should have a traceable source.
The language component uses retrieval augmentation; adding literature is not the same as training new model weights. Improving the relevance and variety of its answers remains an active development task. Patient-history integration and clinical treatment advice are outside the current implementation.
Built on shared research
This integration builds on AutoMorph, by Yukun Zhou and colleagues, for retinal vascular analysis; lesion-based contrastive learning, by Yijin Huang, Li Lin and colleagues, for the lesion-trained representation; and Grad-CAM, by Selvaraju and colleagues, for image-model attribution. Their methods and contributions are acknowledged in the source repository.
RetinalInsight sits within my wider interest in interpretable retinal imaging and oculomics. That wider research includes our survey, The Eye as a Window to Systemic Health, discussed in the Forbes coverage of AI-enabled eye examinations. The new software focuses on contextual DR grading; it does not establish systemic diagnoses.
A prototype with a clear next step
The research setup uses 10,000 EyePACS training images, 2,910 APTOS validation images and 1,636 Messidor-2 test images. An audit identified inconsistent X3 preprocessing in the historical external evaluation. Those scores require consistent reevaluation before they can support performance claims for this upload pipeline.
This is research software requiring clinical review. Model probabilities are uncalibrated; attention and proxy maps are not confirmed lesions. Next steps include consistent external evaluation, closer review of the evidence displays and refinement of the assistant’s answers.
The code, notebook and acknowledgements are available in a dedicated repository. The GitHub Pages dashboard can display saved reports locally in the browser; image analysis and live model questions require a running model environment, such as the Colab notebook.